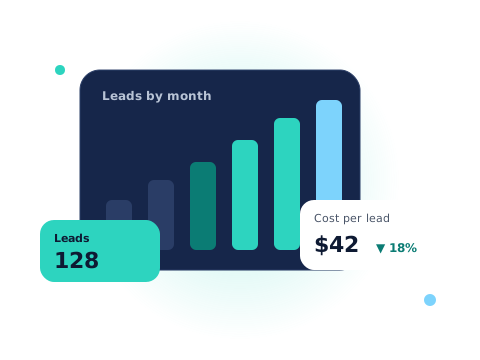
Track leads by source, lead-to-customer conversion rate, cost per lead and per customer, average customer value, and return on marketing spend, reviewed on one simple monthly scorecard.
Key takeaways
- Track leads by source, every month.
- Conversion rate shows whether the problem is marketing or follow-up.
- Cost per customer and customer value tell you what you can afford to spend.
- Review a simple monthly scorecard and act on it.
Marketing reports are often full of impressions, likes and clicks that look busy but don’t answer the real question: is this bringing in customers and profit? These five numbers do. Track them monthly and every marketing decision gets easier.
1. Leads by source
A lead is any real chance of new business: a call, form, booking, chat or walk-in. Count them every month, and record where each one came from, such as Google, Maps, social media, ads, referrals or repeat customers.
How to track it: use call-tracking numbers, UTM links on your campaigns, form tracking in Google Analytics 4, and simply ask new customers “How did you hear about us?”
2. Lead-to-customer conversion rate
Of all the leads you got, how many became paying customers? Divide customers by leads.
If this number is low, the problem may not be marketing at all. It may be response time, pricing or follow-up.
3. Cost per lead and cost per customer
Divide what you spent on a channel by the leads it produced, then by the customers it produced.
This shows which channels are efficient and which ones only look good on paper.
4. Average customer value
How much is a typical customer worth? Start with the average sale. For repeat businesses, go further: average sale × purchases per year × years they stay with you. This is often called customer lifetime value.
Knowing this number tells you how much you can afford to spend to win a customer and still make a profit.
5. Return on marketing spend
Compare the revenue your marketing brought in with what it cost. A simple version: revenue from marketing ÷ marketing spend.
Remember to think about profit, not just revenue, and to give longer-term channels like SEO enough time to pay off.
Put them on one simple scorecard
You don’t need complex software to start. A one-page monthly scorecard with these five numbers, by channel, is enough to spot what is working, cut what isn’t and plan the next month with confidence.
Frequently asked questions
Which tools do I need to track these numbers?
Google Analytics 4, call tracking and a simple CRM or spreadsheet cover most small businesses.
What is a good conversion rate?
It varies widely by industry and price point. The most useful benchmark is your own trend over time.